
How to Calculate Inventory Turnover Ratio: Complete Guide
How to calculate inventory turnover ratio, read the result against industry benchmarks, and fix slow-moving stock: formulas and improvement strategies.
On this page47 sections
Key Takeaways: Divide COGS by Average Inventory
Inventory turnover ratio is calculated as Cost of Goods Sold (COGS) divided by Average Inventory, telling you how many times you sell and replace stock in a period. A higher ratio signals efficient, fast-moving inventory.
- Formula: Inventory Turnover = COGS / Average Inventory.
- Example: $2,000,000 COGS / $400,000 average inventory = a turnover of 5.
- COGS = Beginning Inventory + Purchases - Ending Inventory.
- High turnover means efficient operations; low turnover means cash tied up and possible obsolescence.
What Does Your Inventory Turnover Ratio Tell You?
Inventory turnover ratio is one of the most critical metrics for measuring how efficiently your business manages stock.
A high turnover = Fast-moving inventory, efficient operations
A low turnover = Slow-moving stock, cash tied up, potential obsolescence
This guide covers everything you need to know about inventory turnover: calculation, interpretation, industry benchmarks, and optimization strategies.
What is Inventory Turnover Ratio?
Definition: Inventory turnover ratio measures how many times you sell and replace inventory during a specific period (typically annually).
Formula:
Inventory Turnover = Cost of Goods Sold (COGS) / Average Inventory
Example:
- Annual COGS: $2,000,000
- Average Inventory: $400,000
- Inventory Turnover = $2,000,000 / $400,000 = 5
Meaning: You sold and replaced your entire inventory 5 times during the year.
How to Calculate Inventory Turnover
Step 1: Calculate Cost of Goods Sold (COGS)
COGS Formula:
COGS = Beginning Inventory + Purchases - Ending Inventory
Example:
- Beginning inventory (Jan 1): $350,000
- Purchases during year: $2,100,000
- Ending inventory (Dec 31): $450,000
- COGS = $350,000 + $2,100,000 - $450,000 = $2,000,000
Step 2: Calculate Average Inventory
Average Inventory Formula:
Average Inventory = (Beginning Inventory + Ending Inventory) / 2
Example:
- Beginning inventory: $350,000
- Ending inventory: $450,000
- Average Inventory = ($350,000 + $450,000) / 2 = $400,000
Note: For more accuracy, use monthly averages if data is available.
Step 3: Calculate Turnover Ratio
Inventory Turnover = $2,000,000 / $400,000 = 5
Result: Inventory turns over 5 times per year.
Days Inventory Outstanding (DIO)
What is DIO? The average number of days inventory sits before being sold.
Formula:
DIO = 365 / Inventory Turnover
Example:
- Inventory Turnover: 5
- DIO = 365 / 5 = 73 days
Meaning: On average, inventory sits for 73 days before being sold.
Industry Benchmarks
Retail & E-commerce
Apparel:
- Turnover: 3-5
- DIO: 73-122 days
Electronics:
- Turnover: 6-8
- DIO: 46-61 days
Grocery:
- Turnover: 12-20
- DIO: 18-30 days
Furniture:
- Turnover: 4-6
- DIO: 61-91 days
Manufacturing
Automotive:
- Turnover: 6-10
- DIO: 37-61 days
Consumer Goods:
- Turnover: 4-8
- DIO: 46-91 days
Industrial Equipment:
- Turnover: 2-4
- DIO: 91-183 days
Wholesale & Distribution
Food & Beverage:
- Turnover: 10-15
- DIO: 24-37 days
General Merchandise:
- Turnover: 5-8
- DIO: 46-73 days
Interpreting Your Turnover Ratio
High Turnover (8+)
Pros:
- Less capital tied up
- Lower storage costs
- Fresh inventory
- Reduced obsolescence risk
Cons:
- Potential stockouts
- Lost sales opportunities
- Higher ordering costs
- Less negotiating power
Low Turnover (< 3)
Pros:
- Buffer against stockouts
- Bulk purchasing discounts
- Ability to fulfill large orders
Cons:
- High carrying costs
- Cash flow issues
- Obsolescence risk
- Storage space constraints
Optimal Turnover
Sweet spot: Varies by industry, but generally 4-8 for most businesses.
Goal: Balance between:
- Avoiding stockouts (customer satisfaction)
- Minimizing excess inventory (cash flow)
- Optimizing storage costs
How to Improve Inventory Turnover
1. Demand Forecasting
Strategy: Predict demand more accurately
Methods:
- Historical sales analysis
- Seasonal trend forecasting
- Market research
- Predictive analytics
ROI: 20-30% reduction in excess inventory
2. ABC Analysis
Strategy: Focus on high-value, fast-moving items
Classification:
- A Items (20% of SKUs, 80% of revenue): Tight control, frequent replenishment
- B Items (30% of SKUs, 15% of revenue): Moderate control
- C Items (50% of SKUs, 5% of revenue): Minimal control, bulk orders
ROI: 15-25% improvement in turnover for A items
3. Just-In-Time (JIT) Inventory
Strategy: Order inventory as needed, not in advance
Benefits:
- Reduced holding costs
- Less capital tied up
- Fresher inventory
Challenges:
- Requires reliable suppliers
- Risk of stockouts
- Higher ordering frequency
Best for: Businesses with predictable demand and reliable supply chains
4. Supplier Lead Time Reduction
Strategy: Negotiate faster delivery times
Actions:
- Partner with local suppliers
- Consolidate suppliers for better terms
- Use vendor-managed inventory (VMI)
ROI: 10-15% improvement in turnover
5. Dynamic Pricing
Strategy: Discount slow-moving inventory
Tactics:
- Flash sales for overstocked items
- Bundle slow movers with fast movers
- Seasonal clearance sales
ROI: Clear 30-50% of slow-moving stock within 2 weeks
6. Improve Product Mix
Strategy: Eliminate dead stock, focus on winners
Actions:
- Discontinue SKUs with turnover < 2
- Expand successful product lines
- Test new products in small quantities
ROI: 20-40% overall turnover improvement
7. Automation & Technology
Strategy: Implement inventory management system
Features:
- Real-time stock levels
- Automated reorder points
- Demand forecasting
- ABC analysis automation
ROI: 30-50% reduction in excess inventory, 99% accuracy
Turnover by Product Category
Example: Electronics Retailer
Smartphones:
- Turnover: 12
- Strategy: Frequent restocking, minimal safety stock
Laptops:
- Turnover: 8
- Strategy: Balanced approach
Accessories:
- Turnover: 6
- Strategy: Bulk orders, promotional bundling
Monitors:
- Turnover: 4
- Strategy: Larger safety stock, less frequent orders
Common Mistakes
Mistake #1: Using Sales Revenue Instead of COGS
Wrong:
Turnover = Sales Revenue / Average Inventory
Right:
Turnover = COGS / Average Inventory
Why: Sales includes markup, inflating the ratio artificially.
Mistake #2: Ignoring Seasonality
Problem: Annual turnover doesn't show seasonal peaks/valleys.
Solution: Calculate quarterly or monthly turnover to identify seasonal patterns.
Mistake #3: One-Size-Fits-All Target
Problem: Applying same turnover target to all product categories.
Solution: Set category-specific targets based on demand variability and margins.
Mistake #4: Chasing High Turnover at All Costs
Problem: Frequent stockouts, lost sales, dissatisfied customers.
Solution: Balance turnover with service level (fill rate 95-98%).
Advanced Analysis
Inventory Turnover by Location
Multi-location businesses:
Location A (High Traffic):
- Turnover: 8
- Strategy: Frequent small shipments
Location B (Medium Traffic):
- Turnover: 5
- Strategy: Balanced approach
Location C (Low Traffic):
- Turnover: 3
- Strategy: Share inventory with other locations, use transfers
Turnover vs. Profit Margin
High Turnover, Low Margin (Grocery):
- Make money on volume
- Example: 15 turnover × 5% margin = 75% annual ROI
Low Turnover, High Margin (Jewelry):
- Make money on margin
- Example: 2 turnover × 50% margin = 100% annual ROI
Optimal: Balance depends on your business model
Real-World Case Study
Company: Mid-Size E-commerce (Electronics)
Before:
- Inventory Turnover: 4
- DIO: 91 days
- Excess inventory: $500K
- Stockouts: 12% of orders
Actions Taken:
- Implemented inventory management system
- ABC analysis and focused on A items
- Improved demand forecasting
- Negotiated faster supplier lead times
- Dynamic pricing for slow movers
After (12 months):
- Inventory Turnover: 7
- DIO: 52 days
- Excess inventory: $180K (64% reduction)
- Stockouts: 3% (75% reduction)
- Cash flow improvement: $320K freed up
ROI: System cost $40K, annual savings $80K (2X return)
How to Track Turnover
Monthly Tracking
Dashboard Metrics:
- Current turnover ratio
- Trend (improving/declining)
- Comparison to target
- Category-wise breakdown
- Top 10 slow movers
Review Frequency: Monthly
Automated Alerts
Set alerts for:
- Turnover drops below target (e.g., < 4)
- Specific SKU turnover < 1 (consider discontinuing)
- Category turnover deviates 20%+ from benchmark
Track Turnover Monthly and Improve One Strategy at a Time
Key Takeaways:
- Calculate turnover regularly (monthly preferred)
- Set category-specific targets (not one-size-fits-all)
- Balance turnover with service level (avoid excessive stockouts)
- Use technology for accuracy (inventory management system)
- Focus on improvement, not perfection (incremental gains compound)
Next Steps:
- Calculate your current turnover using the formula above
- Compare to industry benchmarks
- Identify improvement opportunities (ABC analysis, forecasting, etc.)
- Implement one strategy at a time and measure results
Ready to optimize your inventory turnover?
Get Your Free Inventory Assessment
We'll:
- Calculate your current turnover ratio
- Compare to industry benchmarks
- Identify quick wins
- Recommend specific improvement strategies
Turnover only improves once the system underneath it can see stock accurately. That is what custom WMS development is for.
Frequently Asked Questions
What is the formula for inventory turnover ratio?
Inventory turnover ratio equals Cost of Goods Sold (COGS) divided by Average Inventory. For example, $2,000,000 in annual COGS divided by $400,000 in average inventory gives a turnover of 5, meaning you sold and replaced your entire inventory five times during the year.
Should I use sales revenue or COGS to calculate inventory turnover?
Always use COGS, not sales revenue. Sales revenue includes markup, which artificially inflates the ratio. The correct formula is COGS divided by Average Inventory, where average inventory is the beginning inventory plus ending inventory divided by two.
What is a good inventory turnover ratio?
It varies by industry, but the general sweet spot for most businesses is between 4 and 8. The goal is to balance avoiding stockouts for customer satisfaction, minimizing excess inventory for cash flow, and optimizing storage costs. Grocery can run 12-20 while industrial equipment may sit at 2-4.
What is Days Inventory Outstanding (DIO) and how is it calculated?
DIO is the average number of days inventory sits before being sold. It is calculated as 365 divided by your inventory turnover ratio. With a turnover of 5, DIO equals 365 divided by 5, or 73 days.
How can I improve my inventory turnover ratio?
The blog outlines seven strategies: better demand forecasting, ABC analysis to focus on high-value items, just-in-time inventory, reducing supplier lead times, dynamic pricing for slow movers, improving product mix by eliminating dead stock, and implementing inventory management automation. Implement one strategy at a time and measure results.
Why shouldn't I chase the highest possible inventory turnover?
Pushing turnover too high causes frequent stockouts, lost sales, and dissatisfied customers. The right approach balances turnover with service level, typically targeting a fill rate of 95-98 percent, and sets category-specific targets rather than a single one-size-fits-all goal.
Counts still drifting?
Inventory accuracy is a systems problem before it is a process problem. Send us how you track stock today and we will tell you what it takes to make the numbers hold.
Continue learning
Written by
Nirmal JTeam Lead, WMS & Inventory Systems, Rorix Technologies
Nirmal leads WMS and inventory software delivery at Rorix, from warehouse picking and stock control to real-time inventory tracking and fulfillment workflows. He manages project timelines, stakeholder alignment, and sprint execution, ensuring production-ready systems are delivered on time and keep operations running without disruption.
View full profileRelated articles
Inventory Management Best Practices: Complete Guide (2026)
Master inventory management with proven best practices. Learn stock optimization, demand forecasting, ABC analysis, and automation strategies for 99%+ accuracy.
Read article
Warehouse Layout Optimization: Complete Design Guide
Learn how to optimize warehouse layout for maximum efficiency. Includes layout types, design principles, flow patterns, and real-world case studies.
Read article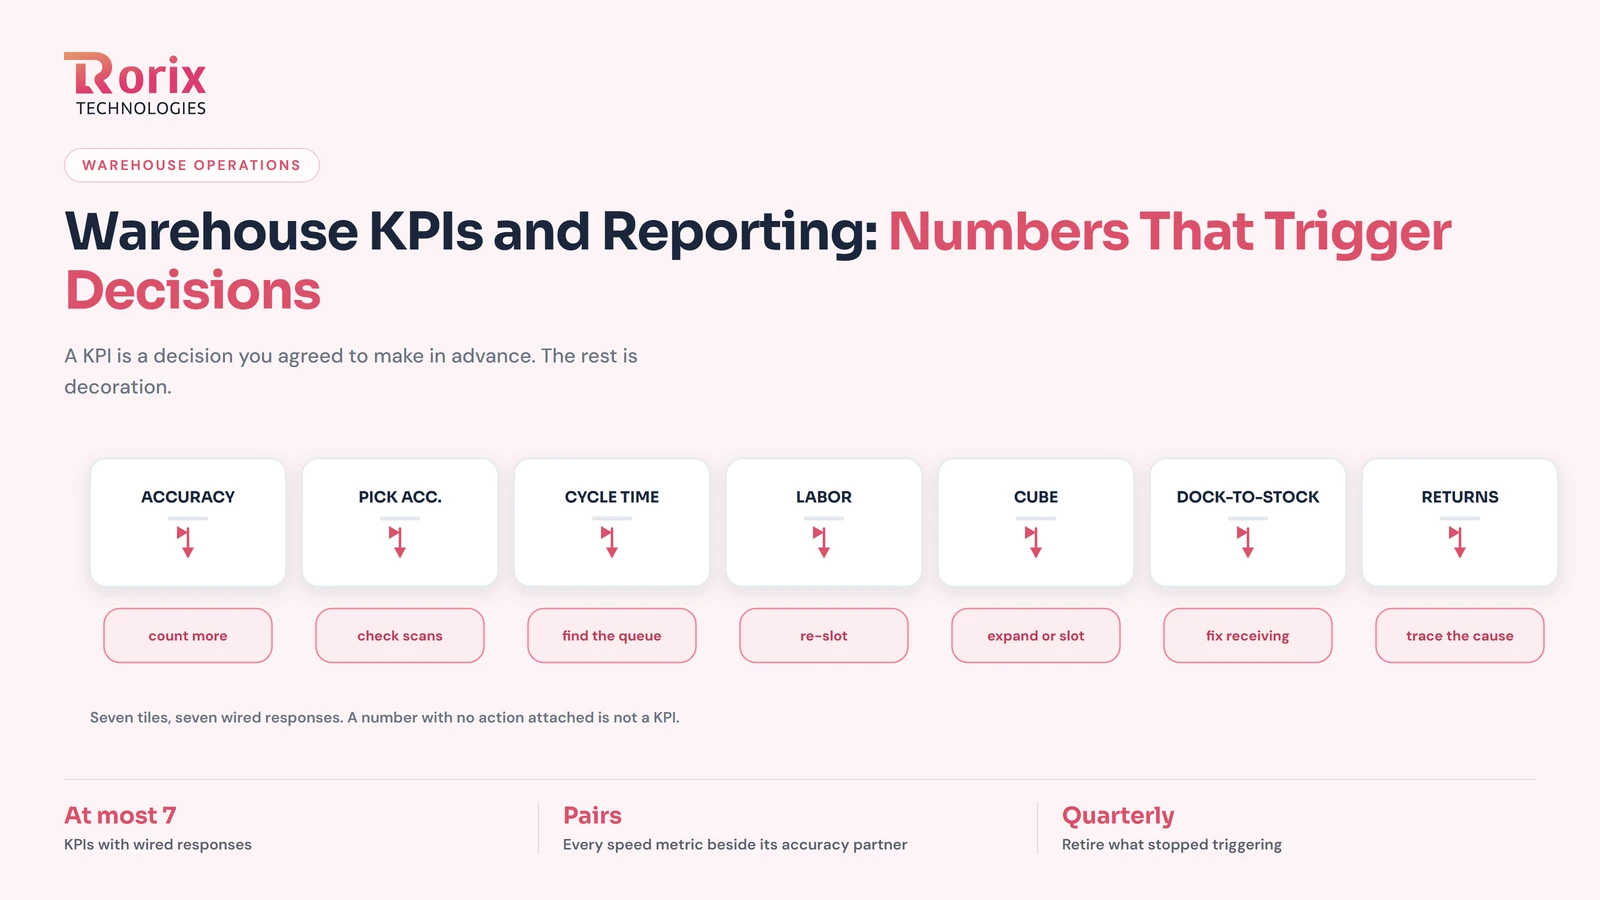
Warehouse KPIs and Reporting: The Numbers That Trigger Decisions
Warehouse KPIs that earn their place: the decision each metric triggers, the formulas, the measurement traps, and the reporting cadence that makes numbers act.
Read article