
Inventory Management Best Practices: Complete Guide (2026)
Master inventory management with proven best practices. Learn stock optimization, demand forecasting, ABC analysis, and automation strategies for 99%+ accuracy.
On this page45 sections
Key Takeaways: Five Practices Behind Accurate Inventory
The best inventory management practices combine ABC classification, accurate demand forecasting, disciplined cycle counting, FIFO/LIFO/FEFO stock rotation, and automation to reach 99%+ inventory accuracy. Applied together, they cut stockouts and free up working capital tied in excess stock.
- Use ABC analysis to focus tight control on A items (20% of items, 80% of revenue) and lighter control on C items.
- Excess inventory ties up 30-40% of working capital, and carrying costs eat 20-30% of inventory value per year.
- Run cycle counts by class (daily for A, weekly for B) and add safety stock based on forecast accuracy.
- Apply FIFO/LIFO/FEFO rotation and automation to scale these practices across the warehouse.
What Poor Inventory Management Costs a Business
Poor inventory management costs businesses millions through:
- Stockouts losing $1 trillion annually in sales (IHL Group)
- Excess inventory tying up 30-40% of working capital
- Write-offs from obsolete or expired stock
- Carrying costs eating 20-30% of inventory value per year
This guide covers 20+ proven best practices to achieve 99%+ inventory accuracy and optimize stock levels. Modern warehouse management systems are essential for implementing these best practices at scale.
What you'll learn:
- ABC analysis and cycle counting
- Demand forecasting techniques
- Safety stock calculations
- FIFO/LIFO/FEFO strategies
- Automation and technology
- KPIs and metrics
Part 1: Inventory Classification & Organization
1. Implement ABC Analysis
What is ABC Analysis?
Classify inventory into three categories based on value:
- A Items (20%): High value, 80% of revenue
- B Items (30%): Moderate value, 15% of revenue
- C Items (50%): Low value, 5% of revenue
Best Practices:
A Items:
- Daily cycle counts
- Tight control and monitoring
- Accurate demand forecasting
- Lower safety stock (due to better forecasting)
- Premium storage locations
B Items:
- Weekly cycle counts
- Moderate control
- Standard forecasting
- Moderate safety stock
C Items:
- Monthly cycle counts
- Minimal control
- Simple forecasting (moving average)
- Higher safety stock (to avoid stockouts)
ROI: Focus 80% of effort on 20% of items that drive 80% of revenue. Calculate your potential inventory optimization savings with our ROI Calculator.
Estimate Your WMS ROI
Get a preliminary estimate of potential savings with a modern warehouse management system. Estimates based on industry averages; individual results vary.
2. Optimize Warehouse Layout
Slotting Strategies:
Fast Movers:
- Store near packing stations
- Reduce travel time
- Golden zone placement (waist to shoulder height)
Slow Movers:
- Higher shelves or back locations
- Less accessible areas
- Bulk storage
Seasonal Items:
- Flexible storage zones
- Easy to relocate
- Separate seasonal area
Best Practice: Use pick frequency data to optimize slotting every quarter.
ROI: 20-30% reduction in picking time.
3. Implement Bin Location System
Why It Matters:
- Eliminates "Where is it?" time waste
- Enables directed putaway and picking
- Supports multiple locations per SKU
- Enables FIFO/FEFO tracking
Naming Convention Example:
- Zone-Aisle-Rack-Shelf-Bin
- A-12-C-03-05 = Zone A, Aisle 12, Rack C, Shelf 3, Bin 5
Best Practice: Barcode bin locations for scanning accuracy.
Part 2: Inventory Accuracy
4. Implement Cycle Counting
Why Cycle Counting > Annual Physical Inventory:
- Continuous accuracy improvement
- No warehouse shutdown
- Identifies systemic issues
- Faster error correction
Cycle Counting Methods:
ABC-Based Cycle Counting:
- A items: Daily (or every 10 days)
- B items: Weekly (or monthly)
- C items: Quarterly
Random Sampling:
- Count random items daily
- Statistical accuracy tracking
- Unbiased validation
Opportunity-Based:
- Count when bin is empty (zero balance)
- Count after receiving
- Count before shipping (for high-value items)
Best Practice: Target 99% inventory accuracy with 5% of items counted daily.
5. Root Cause Analysis for Discrepancies
When counts don't match:
Common Causes:
- Receiving errors (wrong quantity entered)
- Picking errors (wrong item picked)
- Returns not recorded
- Damaged goods not adjusted
- Putaway errors (wrong location)
- Theft or shrinkage
Best Practice:
- Document every discrepancy
- Identify patterns
- Fix systemic issues
- Retrain as needed
ROI: Fixing root causes prevents recurring errors.
6. Use Barcode/RFID Scanning
Manual Entry Errors: 1 in 300 keystrokes
Barcode Scanning Errors: 1 in 3 million
Barcode Best Practices:
- Scan at every transaction (receive, putaway, pick, ship)
- Validate scans against system data
- Use 2D barcodes for more data (serial numbers, lot, expiry)
RFID Benefits:
- No line-of-sight needed
- Scan multiple items simultaneously
- Real-time location tracking
- Ideal for high-value items
ROI: 99%+ accuracy with barcode/RFID vs. 85-90% with manual entry.
Part 3: Stock Optimization
7. Calculate Optimal Safety Stock
Safety Stock Formula:
Safety Stock = (Max Daily Usage × Max Lead Time) - (Average Daily Usage × Average Lead Time)
Example:
- Average daily usage: 50 units
- Max daily usage: 80 units
- Average lead time: 10 days
- Max lead time: 14 days
Safety Stock = (80 × 14) - (50 × 10) = 1,120 - 500 = 620 units
Advanced: Consider Service Level
Safety Stock = Z-score × Std Dev of Demand × √Lead Time
For 95% service level: Z = 1.65
For 99% service level: Z = 2.33
Best Practice: Review safety stock quarterly based on demand variability.
8. Set Reorder Points
Reorder Point Formula:
Reorder Point = (Average Daily Usage × Lead Time) + Safety Stock
Example:
- Average daily usage: 50 units
- Lead time: 10 days
- Safety stock: 620 units
Reorder Point = (50 × 10) + 620 = 1,120 units
Best Practice: Automate reorder point triggers in your inventory system.
9. Economic Order Quantity (EOQ)
EOQ Formula:
EOQ = √(2 × Annual Demand × Order Cost / Holding Cost per Unit)
Example:
- Annual demand: 10,000 units
- Order cost: $100 per order
- Holding cost: $5 per unit per year
EOQ = √(2 × 10,000 × 100 / 5) = √400,000 = 632 units
Best Practice: Balance ordering costs vs. holding costs to minimize total inventory cost.
10. Demand Forecasting
Forecasting Methods:
Simple Moving Average:
Forecast = (Month1 + Month2 + Month3) / 3
Good for: Stable demand
Weighted Moving Average:
Forecast = (Month1×0.2 + Month2×0.3 + Month3×0.5)
Good for: Recent trends matter more
Exponential Smoothing:
Forecast = α × Actual + (1-α) × Previous Forecast
Good for: Balancing history and recent trends
Seasonal Forecasting: Include seasonal indices for products with seasonality.
Best Practice: Use 12-24 months of historical data. Adjust for promotions, trends, and seasonality.
Part 4: Inventory Processes
11. Implement FIFO (First In, First Out)
Why FIFO:
- Reduces obsolescence
- Ensures product freshness
- Minimizes write-offs
- Required for perishables and dated products
How to Enforce FIFO:
- Date stamp all receipts
- Organize shelves oldest-first
- Use directed picking (system assigns oldest stock)
- Physical barriers (pick from front only)
Best Practice: Use FEFO (First Expired, First Out) for products with expiration dates.
12. Automate Replenishment
Manual Replenishment Problems:
- Human error
- Delayed reactions
- Inconsistent decisions
- Time-consuming
Automated Replenishment:
- System monitors stock levels
- Auto-generates purchase orders at reorder point
- Considers lead times and safety stock
- Learns from consumption patterns
ROI: 50% reduction in stockouts and 20% reduction in excess inventory.
13. Implement Vendor Managed Inventory (VMI)
What is VMI: Supplier monitors your inventory levels and automatically replenishes stock.
Benefits:
- Reduced inventory carrying costs
- Better supplier visibility
- Optimized truck loads
- Reduced stockouts
Best for:
- High-volume, consistent items
- Trusted suppliers
- Items with predictable demand
Best Practice: Start with C items and non-critical supplies (packaging, consumables).
14. Kitting and Assembly
Pre-kitting Benefits:
- Faster order fulfillment
- Reduced picking errors
- Simplified inventory (kit SKU vs. individual parts)
- Easier forecasting
Example: Electronics company pre-kits:
- Product + Manual + Charger + Warranty Card = Kit SKU
ROI: 40% faster picking for kitted items.
Part 5: Technology & Automation
15. Inventory Management Software
Must-Have Features:
- Real-time inventory visibility
- Multi-location support
- Barcode scanning
- Automated reorder points
- Lot and serial number tracking
- Reporting and analytics
Integration Requirements:
- ERP system
- E-commerce platforms
- Accounting software
- Shipping carriers
ROI: 99%+ accuracy, 30% reduction in labor, real-time visibility.
16. Mobile Picking Solutions
Benefits:
- Directed picking (system tells exactly where to go)
- Real-time updates
- Pick verification via scanning
- Reduced travel time
Pick Strategies:
Single Order Picking:
- Pick one order at a time
- Simple, low error rate
- Slower for high volume
Batch Picking:
- Pick multiple orders in one trip
- Sort at packing station
- 3X faster than single order picking
Wave Picking:
- Pick by zone
- Pass to next zone
- Ideal for large warehouses
Best Practice: Use batch picking for small items, single picking for large/heavy items.
17. Automated Data Capture
Technologies:
Barcode Scanning:
- 1D barcodes: Basic product info
- 2D barcodes (QR): More data (lot, serial, expiry)
- Cost: $100-$500 per scanner
RFID:
- Passive tags: $0.10-$1.00 per tag
- Active tags: $5-$50 per tag
- Read distance: Up to 40 feet
- Best for: High-value items, real-time tracking
Voice Picking:
- Hands-free operation
- Verbal commands and confirmations
- Best for: Cold storage, bulky items
Best Practice: Use barcodes for 90% of items, RFID for high-value or loss-prone items.
18. IoT and Sensors
Use Cases:
Temperature Monitoring:
- Alerts for out-of-range temps
- Compliance documentation
- Critical for pharma, food
Location Tracking:
- Real-time asset location
- Reduce search time
- Prevent loss
Condition Monitoring:
- Humidity, vibration, light exposure
- Predictive maintenance
- Quality assurance
ROI: Prevent $50K-$500K in spoilage annually for temperature-sensitive products.
Part 6: Inventory Metrics & KPIs
19. Track Key Performance Indicators
Inventory Accuracy:
Inventory Accuracy = (Items Counted Correctly / Total Items Counted) × 100%
Target: 99%+
Inventory Turnover:
Inventory Turnover = Cost of Goods Sold / Average Inventory Value
Target: Industry-specific (4-12 for most industries)
Fill Rate:
Fill Rate = (Orders Fulfilled Completely / Total Orders) × 100%
Target: 98%+
Days of Inventory:
Days of Inventory = (Average Inventory / COGS) × 365
Target: Industry-specific (30-90 days typical)
Stockout Rate:
Stockout Rate = (Stockout Incidents / Total Demand) × 100%
Target: <2%
Carrying Cost:
Carrying Cost = (Storage + Insurance + Obsolescence + Capital Cost) / Avg Inventory Value
Typical: 20-30% of inventory value annually
20. Demand Forecast Accuracy
Forecast Accuracy = 1 - (|Actual - Forecast| / Actual)
Example:
- Forecast: 1,000 units
- Actual: 1,100 units
- Accuracy = 1 - (100/1,100) = 90.9%
Target: 85%+ forecast accuracy
Best Practice: Review forecast accuracy monthly and adjust forecasting methods.
Part 7: Special Scenarios
21. Multi-Location Inventory
Challenges:
- Stock visibility across locations
- Inter-location transfers
- Optimal allocation
- Centralized vs. distributed stock
Best Practices:
Centralized Dashboard:
- View all locations in real-time
- Identify excess and shortages
- Facilitate transfers
Transfer Management:
- Easy transfer requests
- Transfer in-transit tracking
- Automated stock adjustments
Allocation Rules:
- Allocate to location closest to customer
- Consider stock levels and lead times
- Optimize for shipping costs
22. E-commerce Inventory Sync
Challenge: Selling across multiple channels (website, Amazon, eBay) with one inventory pool.
Best Practices:
Real-Time Sync:
- Update all channels instantly after sale
- Prevent overselling
- Centralized inventory pool
Buffer Stock:
- Reserve 5-10% buffer for marketplace delays
- Prevent overselling from sync lag
Prioritization:
- Prioritize channels (own website > marketplaces)
- Allocate inventory accordingly
ROI: Prevent lost sales from overselling and negative reviews.
23. Returns Management
Best Practices:
Separate Returns Area:
- Quarantine returns before re-stocking
- Inspect for quality
- Prevent damaged goods mixing with good stock
Disposition Process:
- Resellable: Return to stock
- Refurbish: Send to refurb area
- Scrap: Dispose and adjust inventory
Track Return Reasons:
- Identify product quality issues
- Adjust forecasts for high-return items
- Improve product descriptions
Best Practice: Process returns within 24 hours to free up working capital.
Part 8: Common Inventory Mistakes
Mistake #1: No Regular Cycle Counts
Problem: Relying on annual physical inventory only.
Impact: Errors compound over the year, leading to 85-90% accuracy.
Solution: Implement ABC-based cycle counting.
Mistake #2: Not Tracking Lot/Serial Numbers
Problem: Can't trace products in case of recalls or quality issues.
Impact: Costly recalls, regulatory penalties, customer safety risks.
Solution: Implement lot and serial number tracking for all regulated or high-value items.
Mistake #3: Overstocking Slow Movers
Problem: Tying up capital in slow-moving inventory.
Impact: 30-40% of working capital locked, obsolescence risk, storage costs.
Solution: Review slow movers quarterly, run promotions, liquidate dead stock.
Mistake #4: Manual Processes
Problem: Relying on spreadsheets and paper.
Impact: Errors, delays, no real-time visibility, scaling limitations.
Solution: Implement inventory management software.
Conclusion: Your Inventory Optimization Roadmap
Step 1: Assess Current State
- Calculate current accuracy %
- Measure turnover rate
- Identify pain points
Step 2: Quick Wins (Month 1)
- Implement ABC analysis
- Start cycle counting
- Introduce barcode scanning for high-value items
Step 3: Process Improvements (Months 2-3)
- Optimize warehouse layout
- Implement FIFO
- Set reorder points
Step 4: Technology (Months 4-6)
- Implement inventory management software
- Automate replenishment
- Integrate with ERP/e-commerce
Step 5: Continuous Improvement (Ongoing)
- Track KPIs monthly
- Review and optimize quarterly
- Invest in advanced tech (RFID, IoT) as you scale
Ready to achieve 99%+ inventory accuracy?
Get Your Free Inventory Assessment
We'll:
- Analyze your current inventory processes
- Identify quick wins and cost savings
- Recommend the right technology solution
- Provide implementation roadmap and ROI estimate
Schedule Your Free Consultation
About Rorix: We build custom inventory and warehouse management systems, with 27 projects delivered and a 5.0 rating on Clutch. From small e-commerce operations to multi-location enterprises, we build systems that scale with the operation.
Frequently Asked Questions
What inventory accuracy level should I aim for, and how do I get there?
Target 99%+ inventory accuracy. The most reliable path is ABC-based cycle counting (counting about 5% of items daily) combined with barcode or RFID scanning at every transaction. Manual entry produces roughly 85-90% accuracy, while barcode and RFID push it to 99%+.
What is ABC analysis and why does it matter for inventory?
ABC analysis classifies inventory by value: A items (about 20% of items, 80% of revenue), B items (about 30% of items, 15% of revenue), and C items (about 50% of items, 5% of revenue). It lets you focus 80% of your control effort on the 20% of items that drive 80% of revenue, applying daily counts and tighter forecasting to A items and lighter handling to C items.
How do I calculate safety stock and reorder points?
Safety stock equals (max daily usage times max lead time) minus (average daily usage times average lead time); for a service-level approach use Z-score times standard deviation of demand times the square root of lead time. The reorder point is (average daily usage times lead time) plus safety stock, and it should be automated so the system triggers replenishment when stock hits that level.
Should I use FIFO or FEFO for inventory rotation?
Use FIFO (First In, First Out) to reduce obsolescence and write-offs by selling oldest stock first. For products with expiration dates, use FEFO (First Expired, First Out) instead, enforced through date stamping, oldest-first shelving, and directed picking.
What return on investment can inventory automation deliver?
The guide cites concrete gains: automated replenishment can cut stockouts by 50% and excess inventory by 20%, optimized warehouse slotting reduces picking time by 20-30%, batch picking is about 3x faster than single-order picking, and inventory management software supports 99%+ accuracy with around a 30% reduction in labor.
Can Rorix build a custom inventory or warehouse management system for my business?
Yes. Rorix Technologies builds custom inventory and warehouse management systems for operations ranging from small e-commerce to multi-location enterprises, with a typical custom WMS going live in 8-12 weeks. You can request a free inventory assessment to identify quick wins, cost savings, and the right technology fit.
Counts still drifting?
Inventory accuracy is a systems problem before it is a process problem. Send us how you track stock today and we will tell you what it takes to make the numbers hold.
Continue learning
Written by
Nirmal JTeam Lead, WMS & Inventory Systems, Rorix Technologies
Nirmal leads WMS and inventory software delivery at Rorix, from warehouse picking and stock control to real-time inventory tracking and fulfillment workflows. He manages project timelines, stakeholder alignment, and sprint execution, ensuring production-ready systems are delivered on time and keep operations running without disruption.
View full profileRelated articles
How to Calculate Inventory Turnover Ratio: Complete Guide
How to calculate inventory turnover ratio, read the result against industry benchmarks, and fix slow-moving stock: formulas and improvement strategies.
Read article
Warehouse Layout Optimization: Complete Design Guide
Learn how to optimize warehouse layout for maximum efficiency. Includes layout types, design principles, flow patterns, and real-world case studies.
Read article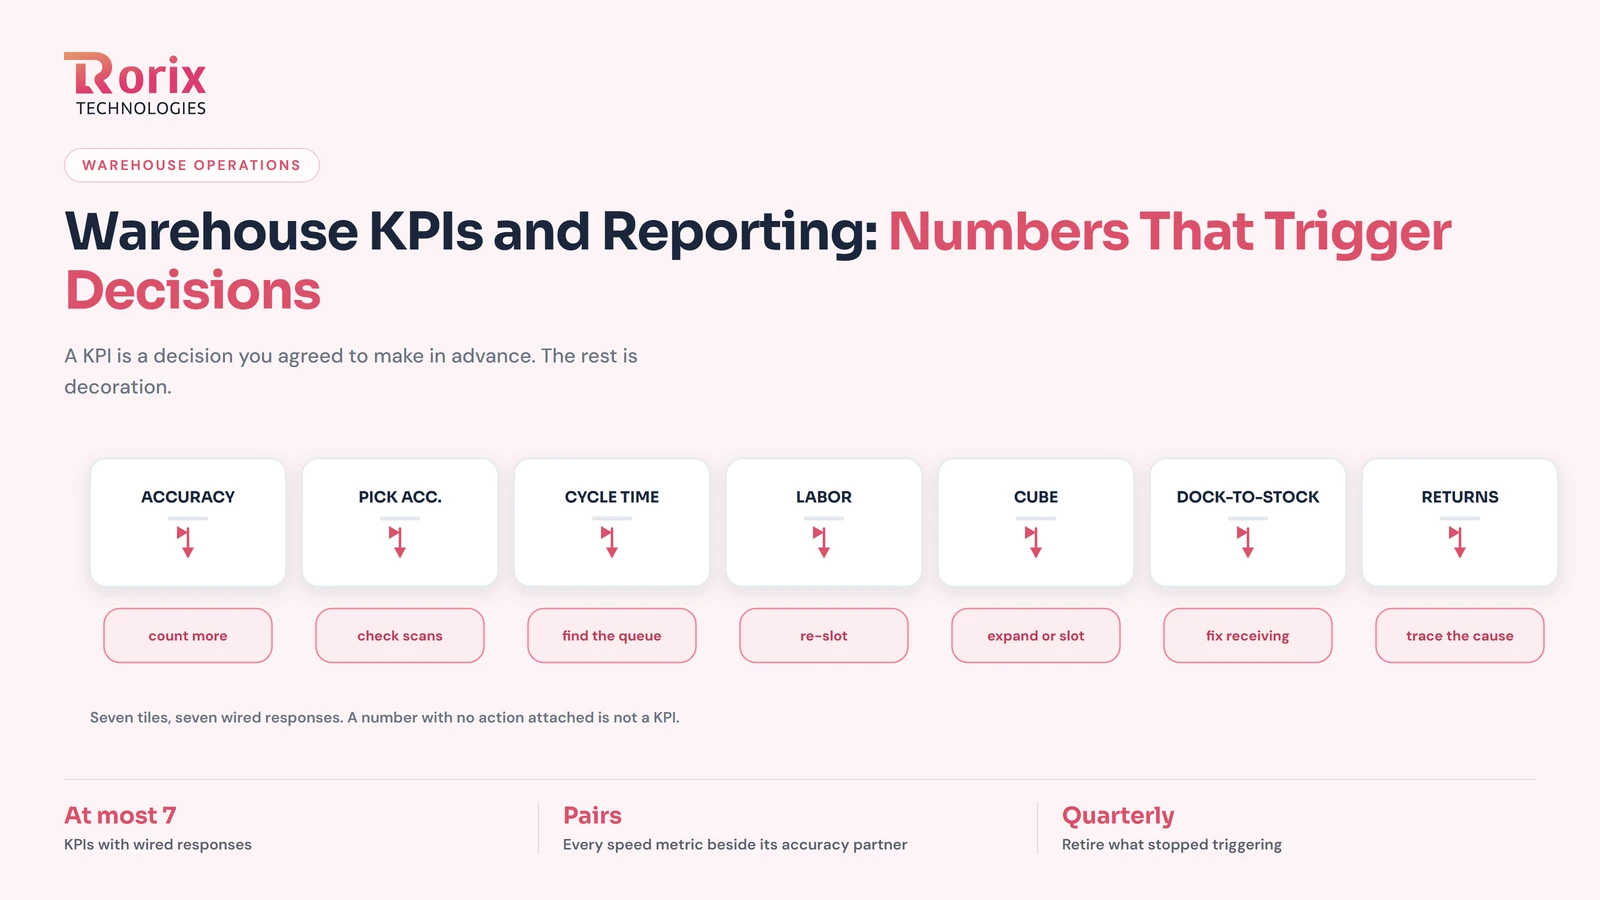
Warehouse KPIs and Reporting: The Numbers That Trigger Decisions
Warehouse KPIs that earn their place: the decision each metric triggers, the formulas, the measurement traps, and the reporting cadence that makes numbers act.
Read article