
Warehouse KPIs and Reporting: The Numbers That Trigger Decisions
Warehouse KPIs that earn their place: the decision each metric triggers, the formulas, the measurement traps, and the reporting cadence that makes numbers act.
On this page28 sections
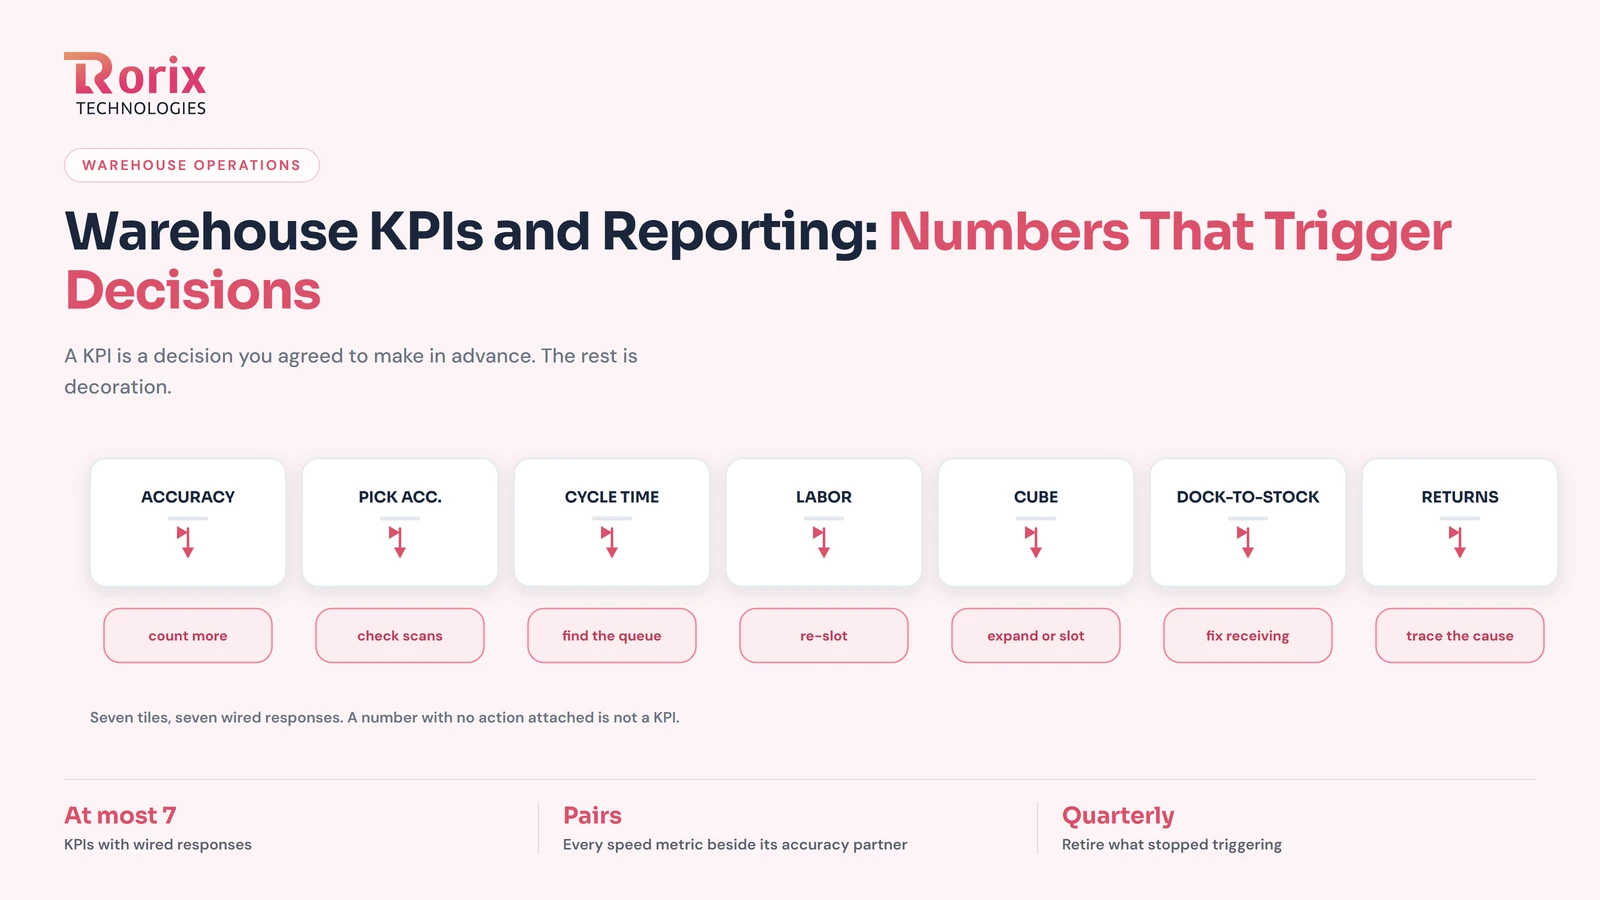
Every modern WMS can put forty numbers on a dashboard. Most warehouses would run better tracking seven, and the difference between the two is not ambition. It is a definition.
A KPI is a decision you agreed to make in advance: when this number moves past this line, we do this specific thing. A number with no action wired to it is not a key performance indicator, whatever the dashboard calls it. It is decoration, and decoration has a cost, because every tile a manager learns to ignore teaches them to ignore the tile next to it. Wiring those definitions into the system itself, rather than into a reporting layer bolted on afterwards, is a large part of what the warehouse management software we build has to get right.
The stakes concentrate where the labor does. With order picking estimated at up to 55% of total warehouse operating expense, a warehouse that measures picking honestly is measuring most of its cost base, and a warehouse that measures it badly is flying its largest budget on instinct. This guide covers the seven KPIs worth wiring to decisions, the formulas behind them, the traps that quietly corrupt each one, and the reporting rhythm that turns numbers into action.
In this guide, you'll learn:
- The definition that separates a KPI from a dashboard tile
- The 7 warehouse KPIs worth tracking, with the decision each one triggers
- The measurement trap inside each metric, and how to close it
- Who should see which numbers, and how often
- A 5-step process for standing up reporting that people actually use
Quick Answer: The 7 Warehouse KPIs That Earn Their Place
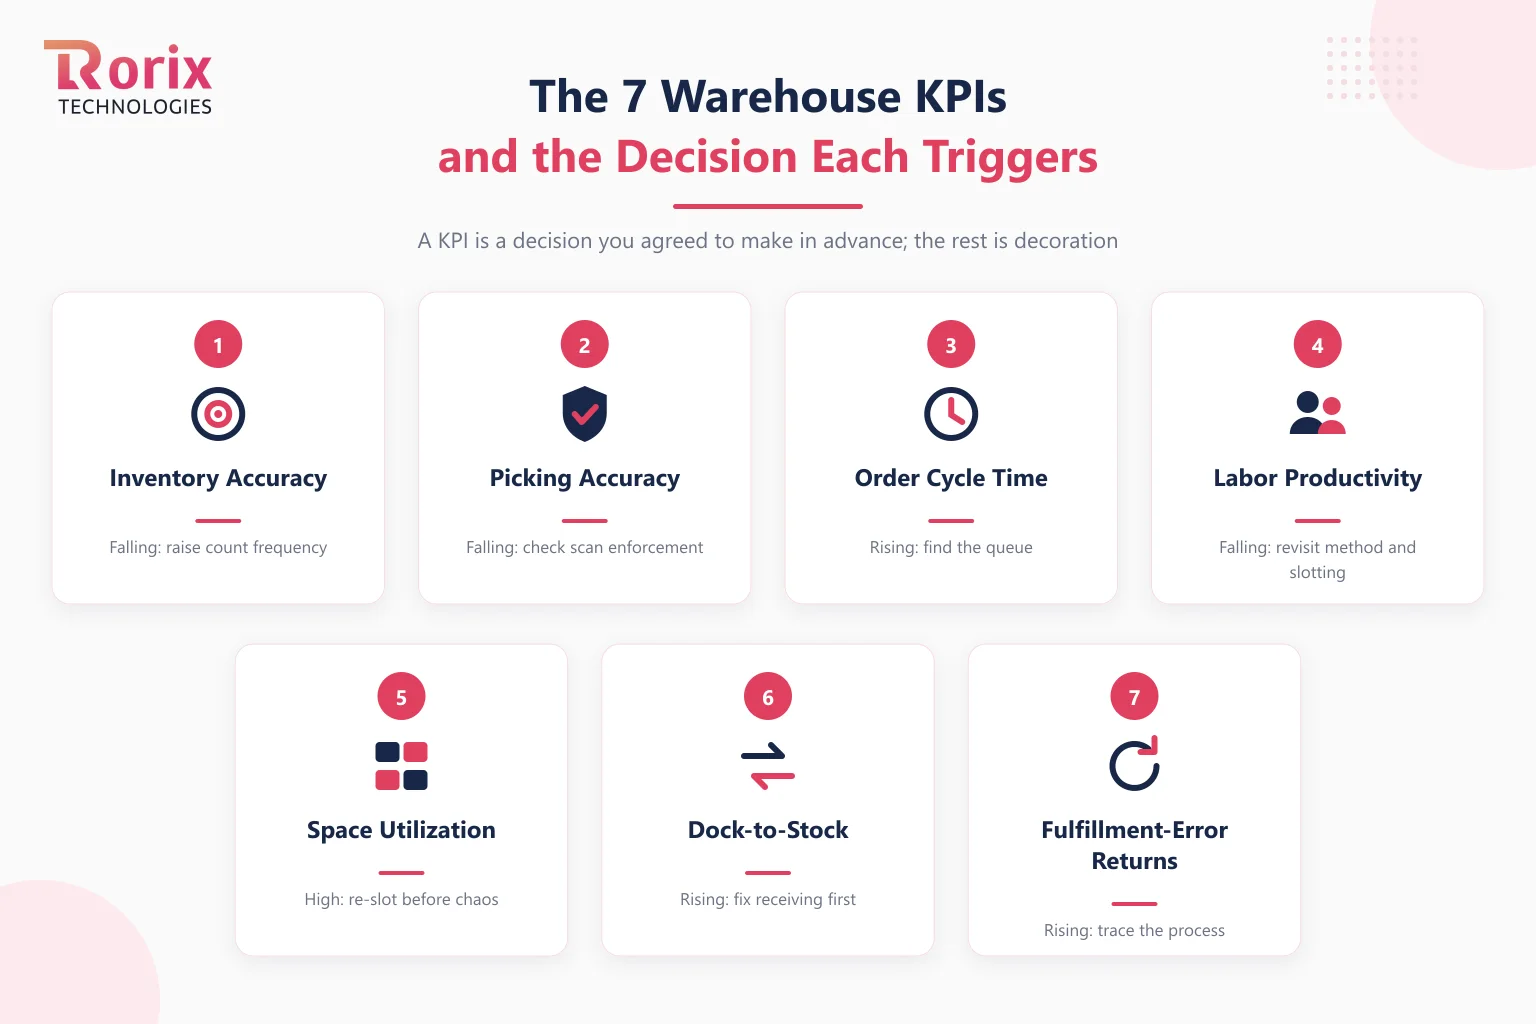
| KPI | What it measures | The decision it triggers |
|---|---|---|
| Inventory accuracy | Records that match the shelf, from rolling cycle counts | Falling: raise count frequency, audit the touches |
| Picking accuracy | Orders picked without error | Falling: check scan enforcement, batch mis-sorts |
| Order cycle time | Order receipt to dispatch | Rising: find the queue, rebalance labor |
| Labor productivity | Lines picked per hour per person | Falling: revisit method, slotting, and travel |
| Space utilization | Share of usable cube in productive use | High: re-slot or expand before chaos, not after |
| Dock-to-stock time | Inbound arrival to sellable | Rising: fix receiving before buying more stock |
| Fulfillment-error return rate | Returns caused by the warehouse, not the product | Rising: trace to the exact process that shipped it |
These are the same seven we recommend tracking after go-live in our WMS buying guide; this post is the operating manual for them.
Key Takeaways: Warehouse KPIs That Trigger Decisions
- A KPI is a number with a pre-agreed response wired to it and a named owner, and a warehouse runs better tracking seven decision-wired metrics than forty dashboard tiles.
- Order picking is estimated at up to 55% of total warehouse operating expense, so a warehouse that measures picking honestly is measuring most of its cost base.
- When the Auburn University RFID Lab and GS1 US audited over a million items, 69% of orders contained data errors under conventional processes, and item-level capture at the touchpoints raised accuracy to 99.9%.
- Healthy operations hold inventory accuracy in the high nineties, keep space utilization inside a 60 to 80% working band, and target under 30 minutes from pick to ship for high-velocity operations.
- Baseline every KPI for 4 weeks before setting targets, pair each speed metric with an accuracy metric, and review the set quarterly to retire any number that has not triggered a decision.
A KPI Is a Pre-Agreed Decision, Not a Dashboard Tile
The test for any metric is one question: if this number moved 10% next week, what would we do? If the answer is specific, the metric is a KPI and belongs on the wall. If the answer is "discuss it," the metric is context, and it belongs in a monthly review, not a daily dashboard.
Two rules follow. First, every KPI needs an owner, one named person who acts when it moves, because a number owned by everyone is owned by no one. Second, every speed metric must be paired with an accuracy metric, because any measured rate can be improved by cheating its unmeasured partner. Pickers can hit any lines-per-hour target you set if mispicks are free. Receiving can clear the dock in record time by skipping the checks that dock-to-stock exists to protect. Pairs keep the numbers honest; solitary metrics teach people to game them.
The 7 KPIs: Formulas, Targets, and the Trap Inside Each
1. Inventory Accuracy
Count locations on a rolling cycle and divide matching counts by total counted. Healthy operations live in the high nineties, and the inventory management practices that hold 99%+ all involve scanning every touch plus scheduled cycle counting.
The trap is the annual stocktake: one big count produces a number that is stale the week after and hides where errors enter. The evidence on where they enter is stark. When the Auburn University RFID Lab and GS1 US audited over a million items, 69% of orders contained data errors under conventional processes; item-level capture at the touchpoints raised accuracy to 99.9%. Errors enter at the touch, so accuracy has to be measured at the touch, not reconstructed at year end.
2. Picking Accuracy
Orders shipped without a picking error, divided by orders shipped. Push it as close to perfect as the operation allows, because every miss lands twice: once in the returns line and once in the customer's memory.
The trap is measuring it from complaints. Customers report a fraction of errors and report them late; scan validation at pick and pack measures all of them at the moment they happen, which is the only version of this number that can trigger a same-day fix.
3. Order Cycle Time
Clock from order receipt to dispatch, and watch the distribution under peak load, not just the average. Our layout optimization guide targets under 30 minutes from pick to ship for high-velocity operations, alongside its travel and pick-density benchmarks.
The trap is where the clock starts. Systems that start timing when the order releases to the floor hide the queue in front of release, which is often where the delay actually lives. Start the clock at receipt, and if the number looks worse, that is the point.
4. Labor Productivity
Lines picked per hour per person, compared against your own baseline rather than industry folklore, because order profile drives this number more than effort does. It is the direct read on the 55% cost block, and the first place picking method changes show up.
The trap is tracking it without its accuracy pair, which converts your incentive system into an error factory. The second trap is comparing across order profiles: a picker on single-line batches and a picker on twenty-line project orders are not producing comparable lines per hour.
5. Space Utilization
Share of usable cube in productive use. The layout guide's published working band is 60 to 80%: below it you are paying rent on air, above it congestion taxes every other KPI on this list.
The trap is measuring floor instead of cube, which flatters a warehouse full of half-empty racking. Measure the volume you could store against the volume you are storing.
6. Dock-to-Stock Time
Hours from truck arrival to sellable, scannable inventory. Nothing a warehouse buys is real until this clock stops, and rising dock-to-stock quietly manufactures stockouts that look like planning failures.
The trap is stopping the clock at putaway while quality holds and label queues keep stock unsellable. Stop it when the unit can actually be picked.
7. Fulfillment-Error Return Rate
Returns caused by warehouse error, kept rigorously separate from product-quality and preference returns, exactly as our buying guide insists. Mixed together, the number blames the warehouse for the product and the product for the warehouse, and triggers nothing useful.
The trap is disposition laziness: if returns processing does not record a cause at receipt, this KPI cannot exist. The cause code is captured in the same scan that receives the return, or it is guessed later.
Who Sees What: Reporting for the Floor, the Supervisor, and the Manager
One dashboard for everyone serves no one, and a system that serves only managers gets ignored by the people who create the numbers. The reporting capability worth demanding from any WMS is role-shaped: the floor sees today's number somewhere visible, large, and current, because a pick rate nobody on the floor can see is not influencing anyone's next hour. Supervisors see live task queues, exceptions, and who is ahead or behind while there is still shift left to act. Managers see trends, distributions, and pairs, the views where slotting decisions and staffing plans actually live.
The cadence follows the audience. Live: task queues and exceptions. Daily: accuracy and throughput against plan. Weekly: productivity, dock-to-stock, and the speed-accuracy pairs. Monthly: cube utilization, trend lines, and re-slotting triggers. Quarterly: the KPI set itself, reviewed against the ROI math it exists to defend.
How to Stand Up Warehouse KPI Reporting in 5 Steps
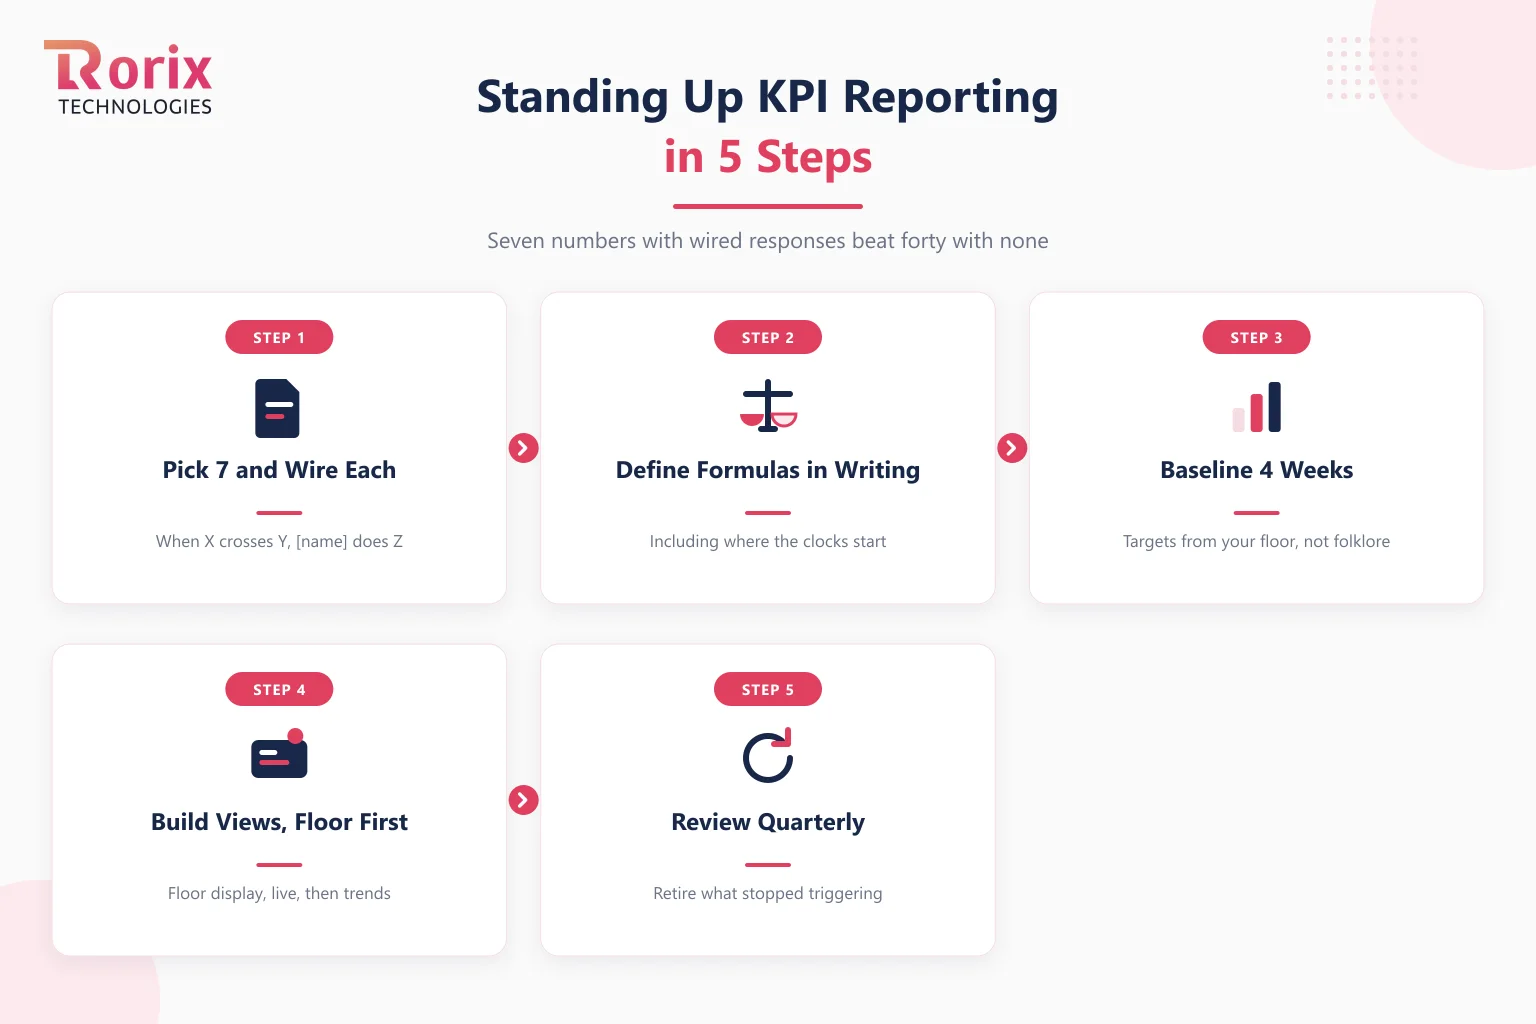
Step 1. Pick at Most 7 KPIs and Wire Each to a Response
For each candidate metric, write the sentence "when this crosses this line, [name] does [action]." A metric that cannot complete the sentence does not make the cut. Seven with wired responses beat forty with none.
Step 2. Define Every Formula in Writing, Including the Clocks
Where does cycle time start and stop? Does dock-to-stock include QC holds? Is accuracy counted by location, unit, or value? Two people computing the same KPI differently is worse than not tracking it, because it manufactures arguments instead of decisions.
Step 3. Baseline for 4 Weeks Before Setting Targets
Targets imported from industry folklore ignore your order profile. Run the definitions for a month, learn your own distribution, and set targets as improvements on your baseline, revisited as the operation changes.
Step 4. Build the Three Views, Floor First
The floor display comes first because it is the one that changes behavior. Then supervisor live views, then manager trends. Building in the reverse order is how reporting projects produce beautiful dashboards and identical operations.
Step 5. Review the KPI Set Quarterly and Retire Decoration
Any number that has not triggered a decision in a quarter gets demoted to the monthly pack. The dashboard is not a museum; it is a set of standing decisions, and it should shrink as often as it grows.
What the WMS Must Provide Underneath the Numbers
Every KPI above is computed from the same raw material: a complete record of touches, who did what, where, and when. A system that stores only current totals cannot produce most of this list honestly, which is the reporting argument for movement-ledger inventory architecture: when every movement is an event, any KPI you invent later is a query, not a wish.
This is also where packaged and custom systems part ways. Vendor report packs answer the questions the vendor imagined; operations with unusual flows end up exporting to spreadsheets, which is where definitions drift and clocks get gamed. When the KPIs that run your business are not the ones in the pack, that gap belongs on the requirements list for a custom WMS build, where the reporting layer is shaped around your decisions instead of around a template.
How Rorix Builds Reporting Into WMS Platforms
Rorix Technologies builds custom warehouse management systems on event-level data models, so the KPIs in this guide are queries against what the floor already recorded rather than a reporting module bolted on later. Floor displays, supervisor live views, and manager trend packs ship as part of the build, shaped around the decisions you named in discovery. We are a senior engineering team with 27 projects delivered and a 5.0 rating on Clutch, working on a retainer model with 2-week sprints, so the KPI set keeps evolving after go-live instead of freezing at it.
To see what the payback math looks like for your own numbers, start with the WMS ROI calculator, or talk to our engineers with your current dashboard and the decisions it has triggered lately.
The Dashboard Is a Set of Standing Decisions
Seven numbers, each with a formula in writing, an owner, a wired response, and an honest clock, will outperform any forty-tile dashboard ever built. Measure the touches, pair speed with accuracy, put today's number where the floor can see it, and retire anything that has stopped triggering decisions. A warehouse that reports this way does not review its performance; it operates on it.
Frequently Asked Questions
What are the most important warehouse KPIs?
Seven earn a place on most floors: inventory accuracy, picking accuracy, order cycle time, labor productivity, space utilization, dock-to-stock time, and fulfillment-error return rate. The selection principle matters more than the list: a KPI is a number with a pre-agreed response wired to it, owned by a named person.
How is inventory accuracy calculated?
Count a rotating sample of locations on a cycle-count schedule and divide the counts that match the system record by the total counted. Rolling cycle counts beat annual stocktakes because they produce a current number and reveal where errors enter. Healthy operations run in the high nineties, and scanning every touch is what holds 99%+.
What is dock-to-stock time and what is a good target?
Dock-to-stock measures the hours from truck arrival to inventory being sellable and scannable in the system. The honest version includes quality holds and labeling queues, not just putaway. Targets vary by receiving complexity, so baseline your own operation for a month and set improvement targets from there.
Why should speed KPIs be paired with accuracy KPIs?
Because any measured rate can be improved by cheating its unmeasured partner. Pickers hit higher lines per hour when mispicks cost nothing; receiving clears the dock faster by skipping checks. Pairing productivity with picking accuracy, and dock-to-stock with receiving accuracy, keeps improvement real instead of relocated.
How many KPIs should a warehouse track?
At most seven as daily, decision-wired KPIs, with everything else demoted to a monthly context pack. The limit is not about data capacity but about attention: every tile a manager learns to ignore trains them to ignore the ones that matter. Review the set quarterly and retire numbers that stopped triggering decisions.
What reports should a WMS produce every day?
Three views, by role: a floor display showing today's pick rate and accuracy where everyone can see it, a supervisor view with live task queues and exceptions while there is shift left to act, and a daily accuracy-and-throughput summary against plan for management. Trend analysis belongs in weekly and monthly views, not the daily flow.
Costing a WMS build?
Send us your SKU count and daily order volume. You get back a scope and a number you can take to your CFO.
Continue learning
Written by
Renish DadhaniyaFounder & Director, Rorix Technologies
Renish co-founded Rorix Technologies and drives the engineering and delivery culture across the organization. Beyond engineering, he leads the company's sales, finance, and HR operations, building the infrastructure that lets the team focus on shipping quality software. With deep hands-on expertise in architecture and team building, he ensures every project lands on time to the quality standards clients demand.
View full profileRelated articles
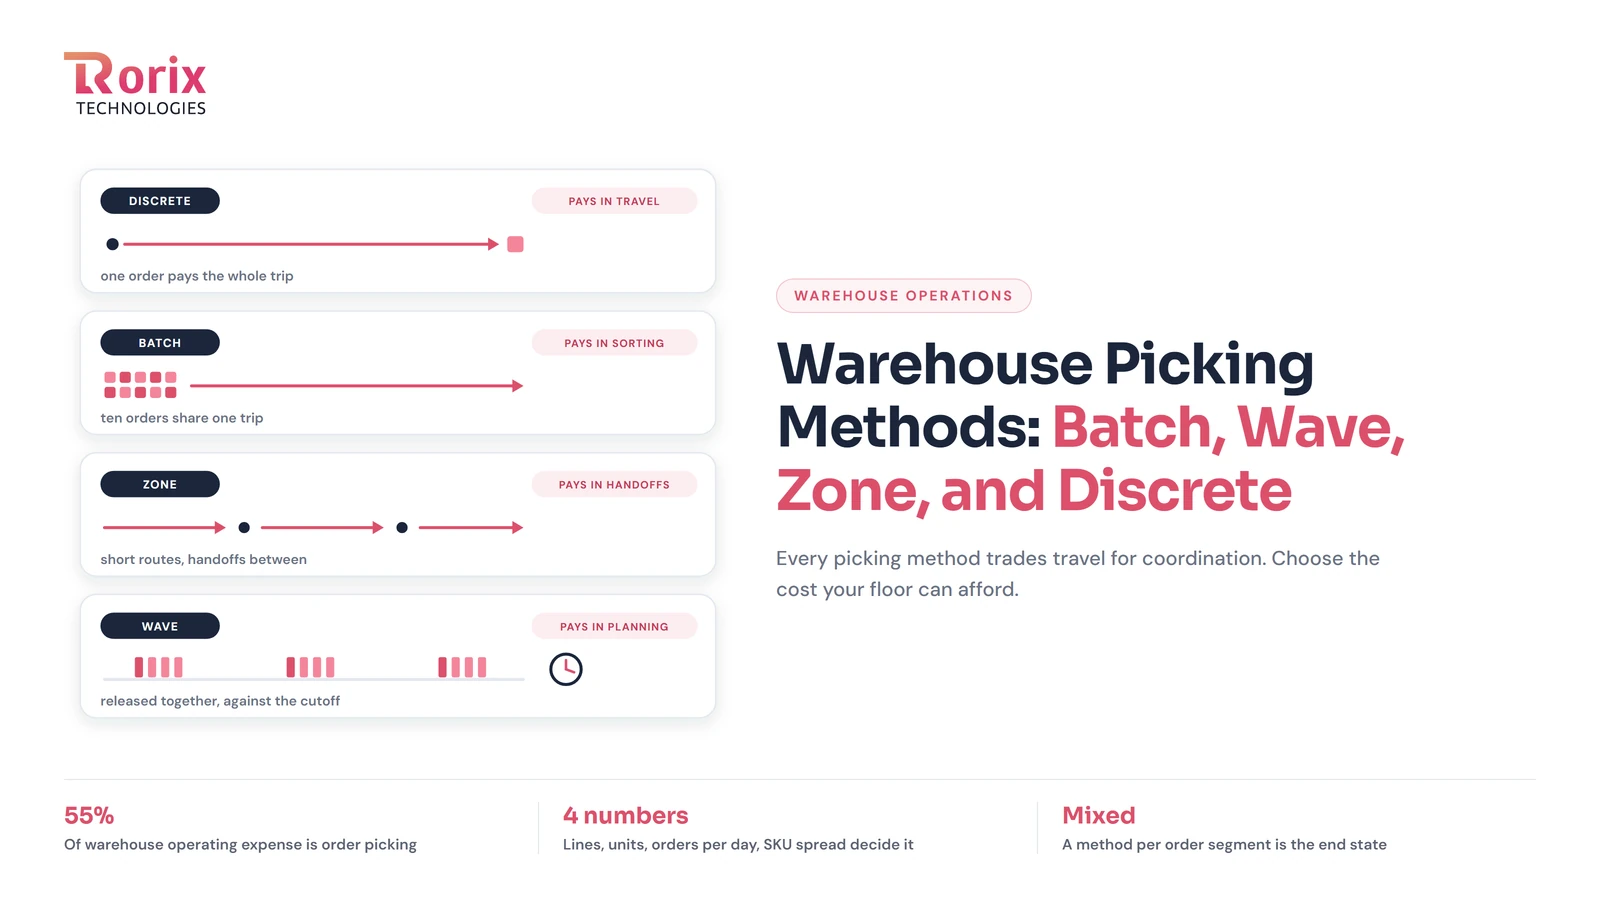
Warehouse Picking Methods: Batch, Wave, Zone, and Discrete, and How to Choose
Warehouse picking methods compared: discrete, batch, zone, wave, and cluster, what each trades for shorter travel, and how to choose by order profile.
Read article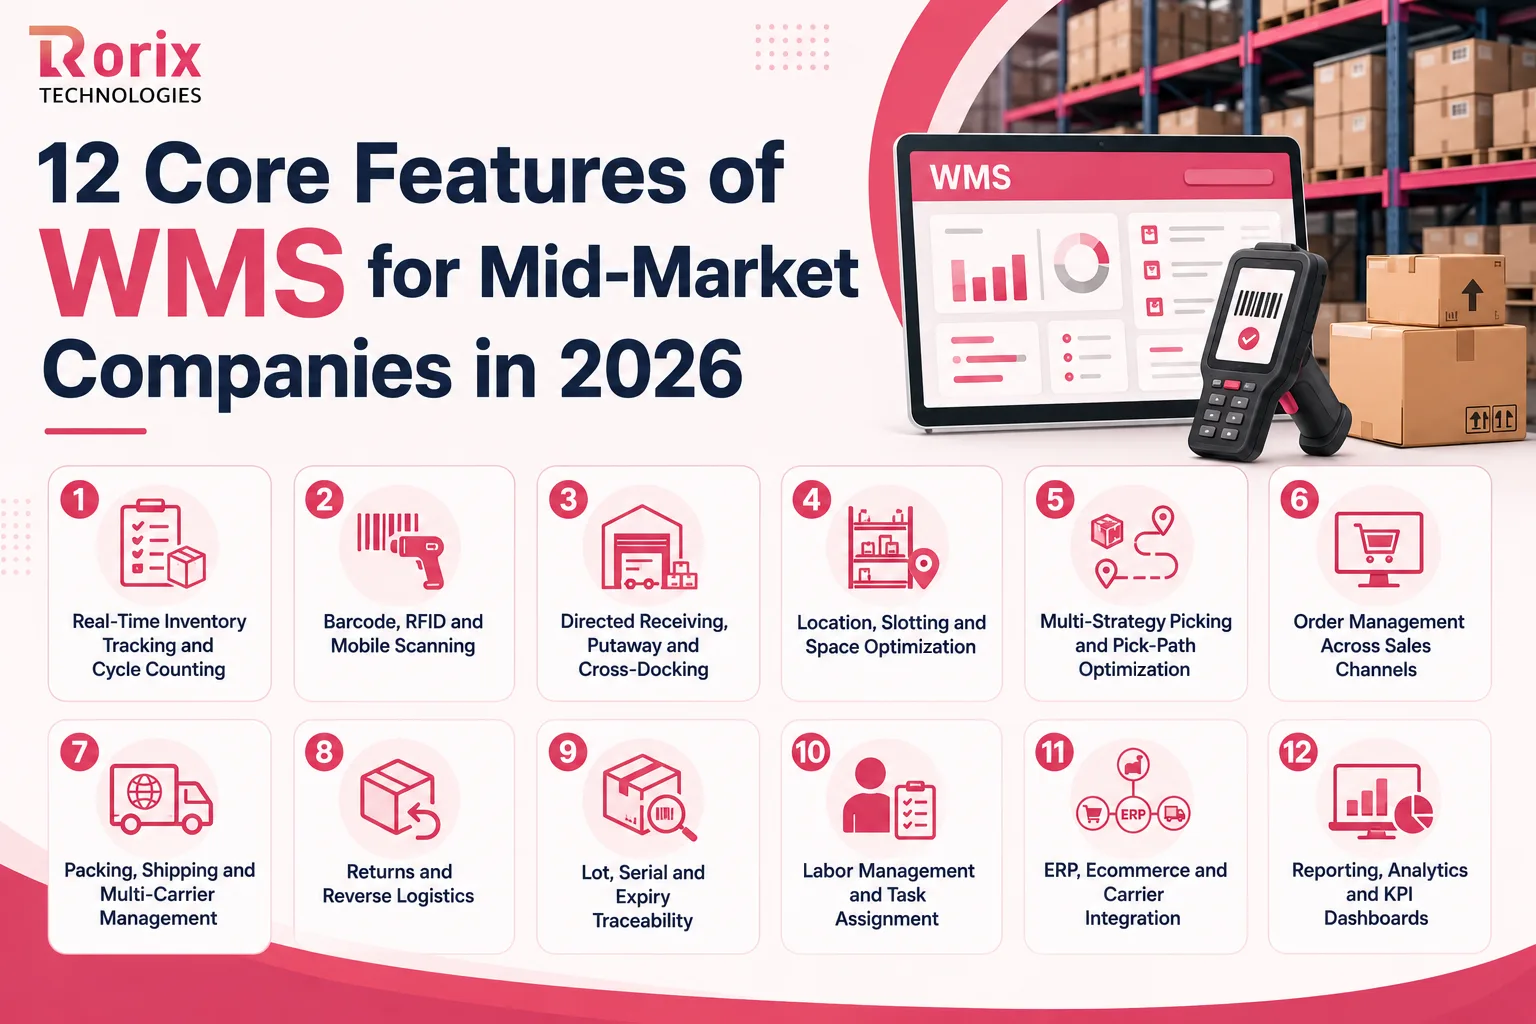
12 Core Features of WMS for Mid-Market Companies in 2026
Which WMS features does a mid-market warehouse need first? Compare all 12, see which seven belong on day one, and how to test each one in a demo.
Read article
How to Calculate Inventory Turnover Ratio: Complete Guide
How to calculate inventory turnover ratio, read the result against industry benchmarks, and fix slow-moving stock: formulas and improvement strategies.
Read article