What Actually Breaks When You Put AI on a Warehouse Dashboard?
On this page8 sections
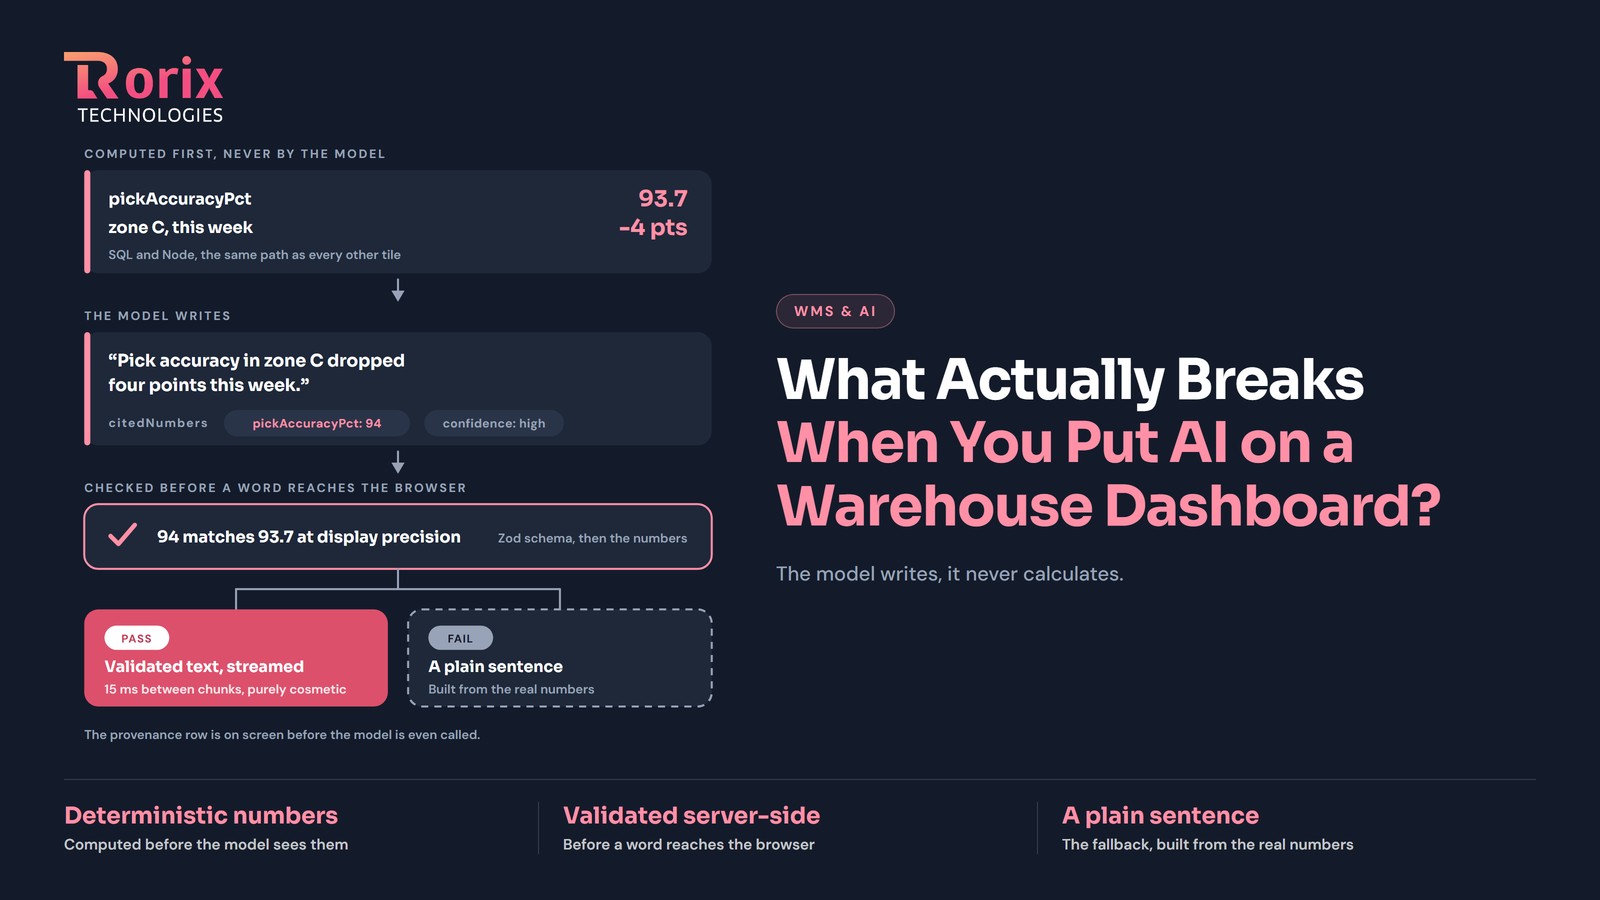
Three things if you read nothing else. The model writes, it never calculates. Every figure is computed deterministically before the model sees it. Validate the whole response server-side before a single word reaches the browser, and when validation fails, fall back to a plain sentence built from the real numbers rather than an error screen.
I have spent the better part of seven years shipping warehouse and operations software, and the AI dashboard we built last year was the first feature where I worried we would make things worse for the user rather than better. Warehouse managers do not have time for a clever demo. They have a dock full of trucks and a screen that needs to tell them the truth. So when a mid-sized third-party logistics client asked us to add AI-generated insights to the WMS platform we shipped for them, my first reaction was caution.
I am keeping the client anonymous and the numbers illustrative. The point is not to brag about a project. The point is that the hard parts of an AI dashboard are not the model. The hard parts are the three seconds after a manager clicks the button, the way partial answers land on screen, and what happens when the model confidently makes something up.
Why we put AI on a warehouse dashboard at all?
The client had a good WMS. Real-time stock, cycle counts, pick accuracy, dock-to-stock times, all of it already tracked. The problem was not missing data. The problem was that nobody had time to read it. A shift supervisor would open the dashboard, see forty tiles of numbers, and go back to firefighting. The dashboard reported reality accurately and helped almost nobody.
What they wanted was a sentence. "Pick accuracy in zone C dropped four points this week, and it lines up with the two new hires who started Monday." That is the kind of thing an experienced ops lead notices and a busy one misses. So the brief was narration, not prediction. Explain the numbers we already compute, in plain language, so a manager glancing at the screen for ten seconds walks away knowing what changed and where to look.
That framing mattered more than any model choice we made. It also set the risk. Trust in AI analytics is thin, and for good reason. insightsoftware's 2026 AI and analytics survey of data and analytics leaders found only about half trust AI-generated insights, with roughly a third naming hallucinations as their main concern and a quarter reporting they had already seen real consequences from bad output. Small sample, vendor-sponsored, so read it as a temperature check rather than gospel. But it matches what I hear from ops teams. If we put one wrong number in front of a decision-maker, we would lose the room permanently.
The rule that made everything else easier
Here is the decision I would defend in any review. The LLM never calculates anything. Not once. Every number on that dashboard is computed the same deterministic way it always was, in SQL and in our Node services, using the same code paths that feed the non-AI tiles. The model receives those pre-computed numbers and is asked to explain them.
I have watched other teams go the other way, wiring a model straight to the database with text-to-SQL so users can ask anything. It demos beautifully. Then it generates a query that silently drops a WHERE clause or joins on the wrong key, and reports a pick accuracy figure that is off by fifteen points. The failure is invisible because the output still looks like a number. This is well documented. The MCS-SQL error analysis found schema linking, meaning the model picking the wrong table or column, was the single most common failure category, around a fifth of errors on both BIRD and Spider. SQLens makes the sharper point: these models routinely produce queries that are syntactically valid and semantically wrong, and you get very little signal about which is which.
If you take one thing from this post, take that. It shrinks the model's job from "be correct about the warehouse" to "write a good sentence about these facts," and the second job is one LLMs are genuinely reliable at.
The same instinct runs through how we handle live data elsewhere on the platform. Keep the server authoritative, treat the fast layer as delivery. I wrote about that in Real-Time Inventory: WebSocket and Pub-Sub Architecture, and the AI narration sits downstream of the same trusted event flow.
Loading states, or why a spinner is a small lie
A normal API call comes back in a couple hundred milliseconds, and a spinner is fine because nobody has time to wonder whether it broke. A model call is different. Ours ran anywhere from three to about fifteen seconds depending on context size and how busy the provider was. A spinner spinning for twelve seconds does not read as working. It reads as frozen. We watched an early tester click refresh twice and then reload the whole page, because a bare spinner gives you no signal that anything is happening underneath it.
The first fix was cheap and it mattered. We replaced the spinner with a skeleton shaped like the insight card that was coming: a title bar and three shimmering placeholder lines at varying widths. The research here is more contested than the design blogs suggest, and some controlled tests find no perceived speed benefit at all. For our case it clearly beat the spinner, mostly because it killed the "is this broken" reflex. The card felt like it was assembling rather than stalling.
The second fix was to say what was actually happening. We put a small status line above the skeleton that tracked the real step: "Reading this week's metrics," then "Writing the summary," then "Checking the numbers." Not a fake progress bar. A manager will forgive a slow feature far more readily than one that seems stuck.
// InsightCard.tsx
import { useMetricInsight } from "./useMetricInsight";
import { ProvenanceFooter } from "./ProvenanceFooter";

type Props = { zoneId: string; metric: string };

export function InsightCard({ zoneId, metric }: Props) {
  const { status, text, phase, provenance, retry } = useMetricInsight(zoneId, metric);

  if (status === "loading") {
    return (
      <article className="insight-card" aria-busy="true">
        <header className="insight-card__title">{metric}</header>
        <p className="insight-card__phase">{phase}</p>
        <div className="skeleton-line" style={{ width: "92%" }} />
        <div className="skeleton-line" style={{ width: "78%" }} />
        <div className="skeleton-line" style={{ width: "84%" }} />
        {/* Provenance arrives before the prose, so the real numbers
            are on screen while the summary is still being written. */}
        {provenance && <ProvenanceFooter numbers={provenance} />}
      </article>
    );
  }

  if (status === "error") {
    return (
      <article className="insight-card insight-card--error">
        <header className="insight-card__title">{metric}</header>
        <p>We could not reach the summary service. The numbers are below.</p>
        {provenance && <ProvenanceFooter numbers={provenance} />}
        <button onClick={retry}>Try again</button>
      </article>
    );
  }

  return (
    <article
      className={
        status === "fallback" ? "insight-card insight-card--fallback" : "insight-card"
      }
    >
      <header className="insight-card__title">{metric}</header>
      <p className="insight-card__body">
        {text}
        {status === "streaming" && <span className="caret" aria-hidden />}
      </p>
      {provenance && <ProvenanceFooter numbers={provenance} />}
    </article>
  );
}
Note that the provenance row renders during loading, not after. The metrics exist before the model is called, so there is no reason to hold them back.
Streaming, and the order we actually shipped it in
This is where our first design was wrong, and I want to be specific because the wrong version is the one most teams build.
The obvious approach is to pipe the model's tokens straight to the browser as they arrive. It feels alive, the text assembles in front of you, and everyone likes the demo. The problem is that it makes validation pointless. If a token containing a wrong percentage has already rendered, rejecting the response afterwards does not help. The manager read it. You cannot un-show a number. There is a second, dumber problem too: we ask the model for a structured object rather than loose prose, so a raw token stream would put JSON braces on screen.
So we do it the other way round. The model generates the full response server-side, we validate it, and only then do we stream the approved summary to the client. The stream is a delivery technique, not a live feed from the model. The paced reveal is cosmetic, roughly fifteen milliseconds between chunks, and it exists because text that assembles reads better than text that snaps into place. We considered the alternative, streaming live and holding the card in an unverified state until validation returned, and rejected it. Marking text as provisional after a manager has already read it solves nothing.
We still use Server-Sent Events for the transport. Data flows one way, the connection is short-lived, it rides ordinary HTTP, and it reconnects on its own. Our WebSocket layer stays where it belongs, on the bidirectional parts of the warehouse floor, the scans and acknowledgements. The major AI SDKs standardised on SSE for the same reasons, which was a small vote of confidence that we had picked the boring correct option.
// insightsStream.ts (Node + Express)
import type { Request, Response } from "express";
import { computeZoneMetrics } from "../metrics/computeZoneMetrics";
import { generateInsight } from "../ai/generateInsight";
import { chunkForDelivery, sleep } from "../utils/stream";

const REVEAL_DELAY_MS = 15;

export async function streamInsight(req: Request, res: Response) {
  const { zoneId, metric } = req.query as { zoneId: string; metric: string };

  res.writeHead(200, {
    "Content-Type": "text/event-stream",
    "Cache-Control": "no-cache",
    Connection: "keep-alive",
  });

  const send = (event: string, data: unknown) =>
    res.write(`event: ${event}\ndata: ${JSON.stringify(data)}\n\n`);

  try {
    // Phase goes out BEFORE the work, or the status line describes the past.
    send("phase", { phase: "Reading this week's metrics" });
    const metrics = await computeZoneMetrics(zoneId, metric);

    // Real figures on screen first. If everything after this dies,
    // the card is still useful.
    send("provenance", { numbers: metrics.forDisplay });

    // generateInsight emits "Writing the summary", then "Checking the numbers".
    const result = await generateInsight(metrics, {
      onPhase: (phase) => send("phase", { phase }),
    });

    if (result.kind === "fallback") {
      send("fallback", { summary: result.summary, reason: result.reason });
      send("done", {});
      return res.end();
    }

    // Validated text only. Paced purely for readability.
    for (const chunk of chunkForDelivery(result.insight.summary)) {
      send("token", { token: chunk });
      await sleep(REVEAL_DELAY_MS);
    }
    send("done", {});
  } catch (err) {
    send("error", { message: "insight_unavailable" });
  } finally {
    res.end();
  }
}
The client hook is deliberately dull. There is nothing clever to debug at 6am.
// useMetricInsight.ts
import { useEffect, useRef, useState, useCallback } from "react";

type Status = "loading" | "streaming" | "done" | "fallback" | "error";

export function useMetricInsight(zoneId: string, metric: string) {
  const [status, setStatus] = useState<Status>("loading");
  const [text, setText] = useState("");
  const [phase, setPhase] = useState("Starting up");
  const [provenance, setProvenance] = useState<null | Record<string, number>>(null);
  const sourceRef = useRef<EventSource | null>(null);

  const connect = useCallback(() => {
    setStatus("loading");
    setText("");
    const es = new EventSource(
      `/api/insight?zoneId=${zoneId}&metric=${encodeURIComponent(metric)}`
    );
    sourceRef.current = es;

    es.addEventListener("phase", (e) => setPhase(JSON.parse(e.data).phase));
    es.addEventListener("provenance", (e) => setProvenance(JSON.parse(e.data).numbers));
    es.addEventListener("token", (e) => {
      setStatus("streaming");
      setText((prev) => prev + JSON.parse(e.data).token);
    });
    es.addEventListener("fallback", (e) => {
      setText(JSON.parse(e.data).summary);
      setStatus("fallback");
      es.close();
    });
    es.addEventListener("done", () => {
      setStatus((s) => (s === "fallback" ? s : "done"));
      es.close();
    });
    es.addEventListener("error", () => { setStatus("error"); es.close(); });
  }, [zoneId, metric]);

  useEffect(() => {
    connect();
    return () => sourceRef.current?.close();
  }, [connect]);

  return { status, text, phase, provenance, retry: connect };
}
One note on backpressure. When several cards stream at once you can hammer React with a state update per chunk, and on a cheap warehouse-office PC that stutters visibly. We batch chunks over a short window before committing to state. If you are running many concurrent streams, budget for that early.
Error handling, or never letting a made-up number reach a manager
This is the part I lost sleep over. A model that writes a fluent, confident sentence about a metric it misread is more dangerous than one that crashes, because the crash is obvious and the confident sentence is not. The model can still misread what we hand it, invent a trend that is not in the data, or return output we cannot parse. So we treat everything coming out of it as untrusted until proven otherwise.
We ask for a structured object rather than prose: the summary text, the specific figures it referenced, and a confidence flag. That object is validated against a Zod schema. Then we do the part most teams skip, which is comparing the numbers the model claims it used against the numbers we computed.
The naive version of that check will reject correct output on day one. A summary that says "94 percent" is fine when the computed value is 93.7, because that is how humans write. Compare at the precision the number is displayed at, not at full float precision, and be explicit that counts have to match exactly.
// validateInsight.ts
import { z } from "zod";

const InsightSchema = z.object({
  summary: z.string().min(1).max(400),
  citedNumbers: z.record(z.string(), z.number()),
  confidence: z.enum(["high", "medium", "low"]),
});

export type Insight = z.infer<typeof InsightSchema>;

// Decimal places each metric is displayed at. Counts are 0 and must match exactly.
const DISPLAY_PRECISION: Record<string, number> = {
  pickAccuracyPct: 0,
  otifPct: 0,
  inventoryTurns: 1,
  dockToStockHours: 1,
  unitsPicked: 0,
  openExceptions: 0,
};

const roundTo = (n: number, dp: number) => {
  const factor = 10 ** dp;
  return Math.round(n * factor) / factor;
};

export function validateInsight(raw: string, truth: Record<string, number>): Insight {
  const parsed = InsightSchema.parse(JSON.parse(raw)); // throws on shape mismatch

  for (const [key, claimed] of Object.entries(parsed.citedNumbers)) {
    const actual = truth[key];
    if (actual === undefined) throw new InsightGroundingError(key, claimed, actual);

    const dp = DISPLAY_PRECISION[key] ?? 1;
    if (roundTo(actual, dp) !== roundTo(claimed, dp)) {
      throw new InsightGroundingError(key, claimed, actual);
    }
  }
  return parsed;
}

export class InsightGroundingError extends Error {
  constructor(public field: string, public claimed: number, public actual?: number) {
    super(`Model cited ${field}=${claimed}, computed value is ${actual}`);
  }
}
Two limits worth stating plainly, because I would rather you hear them from me than find them in production.
The check only catches figures the model declares. A number that shows up in the prose but never lands in citedNumbers sails straight through. We reduce the surface by keeping summaries short and by prompting the model to cite everything numeric it mentions, but it is a mitigation, not a guarantee. The provenance row under every card is the real backstop, because a manager comparing the sentence against the figures directly beneath it will catch what our validator missed.
And self-reported confidence is a soft signal at best. Asking a model how sure it is, from a system that otherwise refuses to trust its judgement, is a slight contradiction and I know it. We use the "low" flag to route to the template path because it costs nothing and it catches some genuinely thin cases, but I would not build anything load-bearing on it.
Around validation sits a bounded retry, then a hard fallback. If the first attempt fails, we send the model its own broken output plus the exact reason and ask it to fix that one thing. One repair, occasionally two. Never a loop, because an unbounded retry is a slow way to burn tokens and keep a user waiting.
// generateInsight.ts
export async function generateInsight(
  metrics: ZoneMetrics,
  opts: { onPhase?: (phase: string) => void; maxRepairs?: number } = {}
): Promise<InsightResult> {
  const { onPhase, maxRepairs = 1 } = opts;
  let lastError = "";

  for (let attempt = 0; attempt <= maxRepairs; attempt++) {
    onPhase?.(attempt === 0 ? "Writing the summary" : "Correcting the summary");
    const raw = await callModel(buildPrompt(metrics, lastError));

    onPhase?.("Checking the numbers");
    try {
      const insight = validateInsight(raw, metrics.forValidation);
      if (insight.confidence === "low") {
        return deterministicFallback(metrics, "low_confidence");
      }
      return { kind: "ai", insight };
    } catch (err) {
      lastError = err instanceof Error ? err.message : String(err);
    }
  }
  return deterministicFallback(metrics, "validation_failed");
}

function deterministicFallback(metrics: ZoneMetrics, reason: string): InsightResult {
  return {
    kind: "fallback",
    reason,
    summary: renderTemplateSummary(metrics), // plain, rule-based sentence
    numbers: metrics.forDisplay,
  };
}
The fallback is not an error screen. It is a plain, template-generated sentence built from the real figures. The user still gets something useful, just without the AI flourish. Native structured output modes have improved a lot and we lean on them, but we still validate our side, because schema-conformant JSON is not the same thing as correct JSON.
The provenance row did more for adoption than any improvement to the prose, which surprised me. The same principle about deciding in advance where you stop trusting the other side runs through API Integration Strategy.
What we got wrong first
Beyond the streaming order, there was a worse one. Our first version computed a couple of small figures inside the model call, because it was faster to build and the numbers were "simple." Order counts, mostly. It worked in testing. Then during a busy week the model narrated a shipment-exception summary and quietly transposed two zone totals, and a supervisor nearly rerouted labour to the wrong aisle before someone noticed the raw report disagreed. Nobody got hurt and no bad decision shipped, but it was the exact failure I had promised myself we would not have.
That incident turned a preference into a rule with no exceptions. We tore out the inline computation, moved every figure to the deterministic path, and added the ground-truth check. It cost about a week and it was the best week we spent on the project. The lesson I keep repeating to my team is that "simple enough for the model to get right" is a trap, because you cannot tell by looking which answers it got wrong.
Cost, latency, and keeping it cheap
Two things kept the bill sane. We cache aggressively, since metrics for a given zone and window change on a known cadence, so identical requests inside that window return a cached narration. Prompt caching on the provider side trims the stable instruction prefix on top of that. And we keep the prompt tight: a compact brief of pre-computed figures, not a dump of raw rows. Low token counts, and less room for the model to wander.
We log every model call with token counts, latency, which validation path it took, and whether it fell back. That last one is the metric I actually watch. A rising fallback rate means the prompt drifted or the provider changed something underneath us, and it shows up before any user complains. If you are running an LLM in production without tracking fallback and validation-failure rates, you are flying blind.
Did it actually help anyone?
We did not want to measure this with a vanity number like insights generated. What mattered was whether managers acted on the dashboard more. So we tracked whether an insight card led to a drill-down into the underlying report, and asked a small group of supervisors to rate weekly whether the summaries told them anything new. Drill-through is the signal, because it means the sentence made someone curious enough to go look. It roughly doubled over the first two months and then held. The qualitative feedback settled on a theme I liked: the value was less about the AI being smart and more about it pointing a tired person at the right tile.
None of this is magic. Deterministic numbers, a model on a short leash, loading states that tell the truth, a stream that only carries validated text, and a fallback that assumes the model will let you down eventually. Get those right and an AI dashboard stops being a risk and starts being useful, which was the whole point.
If you are building something similar into a WMS or an operations platform and want a second set of eyes on the architecture, that is the kind of work we do at Rorix. Bring the constraint you keep hitting and we will walk the design with you.
Related reading: Real-Time Inventory: WebSocket and Pub-Sub Architecture and Event Sourcing for Warehouse Systems: Audit Trails That Hold Up.
Building this into a live warehouse system?
Bring the constraint you keep hitting and a named engineer will walk the design with you.